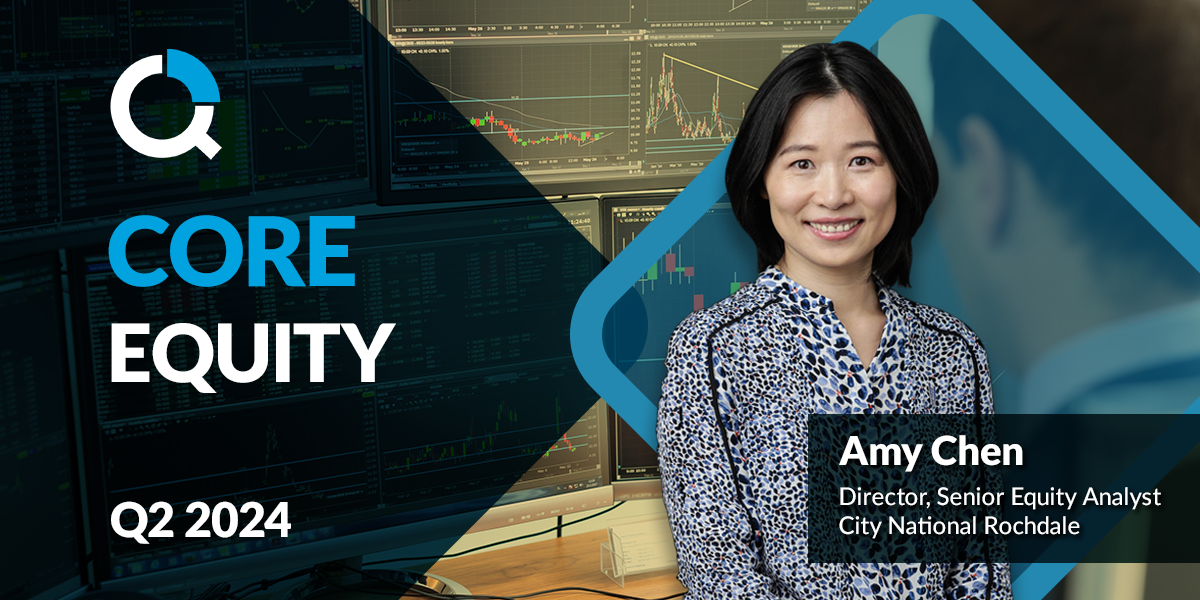
Core Equity – Staying True to Our Approach to Thematic Investing
Key Points
- Portfolio positioned for mild recession
- Disciplined and fundamentally driven investment process drives stock selection
- Focused on high quality, attractively valued companies and key secular themes
In the more than 10 years we’ve been managing the Core Equity Strategy, the foundational elements to our success have been identifying secular themes that can drive above average growth potential, and identifying high quality companies with strong fundamentals selling at reasonable valuations that we can buy and hold for the long term to minimize turnover and capital gains.
Balancing Secular Growth with Cyclical Pressures
Because we continue to anticipate a mild recession, we have been focusing on stocks with the right blends of defense and offense, which come from companies with strong franchises and management teams that can manage their way successfully through the recession, and come out the other side with above average growth prospects. At the thematic level, we have the portfolio positioned with a similar perspective. On the defensive side, we have been overweight healthcare innovators and durable consumer themes. On the offensive side, we have the digital revolution and clean climate theme.
Healthcare Innovators: We own Edward Lifesciences (EW) and HCA Healthcare (HCA), both of which benefit from post pandemic, pent-up demand for elective surgeries. UnitedHealth Group (UNH) is a digital leader in the healthcare insurance business, and a high-quality defensive name that has delivered excellent compounding return over many years.
Durable Consumer Franchises: Costco (COST), WalMart (WMT), McDonald’s (MCD), and PepsiCo PEP) are industry leaders and tend to outperform during recession. We also own Home Depot (HD) on the cyclical side, with secular growth driven by a housing shortage and aging housing stock in the US.
Digital revolution: Despite the AI frenzy sending many prices of many speculative tech stocks soaring, our holdings are rooted by solid balance sheets and strong profitability. Microsoft (MSFT) is one of the largest holdings andhas been prominently featured on the AI stage with Chat-GPT partnership. We also own Equinix (EQIX), a premier data center operator, connecting corporate databases to public and private AI cloud networks, and Adobe (ADBE), a software leader using AI in creative content generation. Our semiconductor holdings, ASML and NXPI, are also well positioned to benefit from AI and industrial automation.
Clean climate: All around the world, governments are fighting global warming by limiting consumption of fossil fuel, and building renewable energy infrastructures. Financial incentives and regulatory requirements are put in place to accelerate those initiatives. We own Quanta Services (PWR) and Trane Technologies (TT), serving to reduce emission and carbon footprints, and Linde (LIN), a leading industrial gas company and a pioneer in the blue hydrogen business.
Chart 1: Thematic Research Focus
*Some stocks are included in more than one theme.
Why Valuation Matters
A good company does not immediately translate into a good stock to own. We have always used a disciplined approach to assess a company’s earning power relative to the price of the stock. One example is Microsoft (MSFT). Valued at 73x P/E at the end of 1999, its multiple subsequently collapsed to 9x after the internet bubble burst. If an investor had purchased the stock at the top, it would have taken sixteen years to get back to breakeven.
Chart 2: Microsoft
Forward Price to Earnings Multiple
Source: Bloomberg, as of June 2023.
Important Disclosures
Important Information
Figures shown are past results and are not an indication of future results.
The information presented does not involve the rendering of personalized investment, financial, legal or tax advice. This presentation is not an offer to buy or sell, or a solicitation of any offer to buy or sell, any of the securities mentioned herein.
This document may contain forward-looking statements relating to the objectives, opportunities and future performance of the US market generally. Forward-looking statements may be identified by the use of such words as: “expect,” “estimated,” “potential” and other similar terms. Examples of forward-looking statements include, but are not limited to, estimates with respect to financial condition, results of operations, and success or lack of success of any particular investment strategy. All are subject to various factors, including, but not limited to, general and local economic conditions, changing levels of competition within certain industries and markets, changes in interest rates, changes in legislation or regulation, and other economic, competitive, governmental, regulatory and technological factors affecting a portfolio’s operations that could cause actual results to differ materially from projected results. Such statements are forward-looking in nature and involve a number of known and unknown risks, uncertainties and other factors, and accordingly, actual results may differ materially from those reflected or contemplated in such forward-looking statements. These statements are based primarily upon a hypothetical set of assumptions applied to certain historical financial information that has been provided by third-party sources and, although believed to be reliable, the information has not been independently verified and its accuracy or completeness cannot be guaranteed. The opinions, projections, forecasts and forward-looking statements expressed are also valid as of the date of this document and are subject to change based on market and other conditions. Prospective investors are cautioned not to place undue reliance on any forward-looking statements or examples. None of City National Rochdale nor any of its affiliates or principals nor any other individual or entity assumes any obligation to update any forward-looking statements as a result of new information, subsequent events or any other circumstances.
This information is not intended as a recommendation to invest in a particular asset class, strategy or product.
The information presented is for illustrative purposes only and based on various assumptions which may not be realized. No representation or warranty is made as to the reasonableness of the assumptions made or that all assumptions used have been stated or fully considered.
All investing is subject to risk, including the possible loss of the money you invest. As with any investment strategy, there is no guarantee that investment objectives will be met, and investors may lose money. Diversification may not protect against market risk or loss. Past performance is no guarantee of future performance.
All investment strategies have the potential for profit or loss; changes in investment strategies, contributions or withdrawals may materially alter the performance and results of a portfolio. Different types of investments involve varying degrees of risk, and there can be no assurance that any specific investment will be suitable or profitable for a client’s investment portfolio.
CNR is free from any political affiliation and does not support any political party or group over another.
This material is available to advisory and sub-advised clients, as well as financial professionals working with City National Rochdale, a SEC-registered investment adviser and a wholly-owned subsidiary of City National Bank. City National Bank provides investment management services through its sub-advisory relationship with City National Rochdale.
Index Definitions
S&P 500 Index: The S&P 500 Index, or Standard & Poor’s 500 Index, is a market-capitalization-weighted index of 500 leading publicly traded companies in the US It is not an exact list of the top 500 US companies by market cap because there are other criteria that the index includes.
Bloomberg Barclays US Aggregate Bond Index (LBUSTRUU): The Bloomberg Aggregate Bond Index or “the Agg” is a broad-based fixed-income index used by bond traders and the managers of mutual funds and exchange-traded funds (ETFs) as a benchmark to measure their relative performance.
GT2 Govt, GT3 Govt, GT5 Govt, GT10 Govt, GT30 Govt: US Government Treasury Yields
DXY Index: The US dollar index (USDX) is a measure of the value of the US dollar relative to the value of a basket of currencies of the majori-ty of the US’s most significant trading partners.
Bloomberg US Investment Grade Corporate Bond Index:The Bloomberg US Investment Grade Corporate Bond Index measures the performance of investment grade, corporate, fixed-rate bonds with maturities of one year or more.
Bloomberg US Corporate High Yield Index:The Bloomberg US Corporate High Yield Index measures the performance of non-investment grade, US dollar-denominated, fixed-rate, taxable corporate bonds.
Bloomberg Municipal Bond Index: The Bloomberg US Municipal Bond Index measures the performance of investment grade, US dollar-denominated, long-term tax-exempt bonds.
Bloomberg Municipal High Yield Bond Index: The Bloomberg Municipal High Yield Bond Index measures the performance of non-investment grade, US dollar-denominated, and non-rated, tax-exempt bonds.
S&P Leveraged Loan Indexes (S&P LL indexes) are capitalization-weighted syndicated loan indexes based upon market weightings, spreads and interest payments. The S&P/LSTA Leveraged Loan 100 Index (LL100) dates back to 2002 and is a daily tradable index for the US market that seeks to mirror the market-weighted performance of the largest institutional leveraged loans, as determined by criteria. Its ticker on Bloomberg is SPBDLLB.
IA SBBI US LT Government: The index measures the performance of US dollar-denominated bonds issued in the US investment-grade bond market including US and non-US corporate securities that have at least ten years to maturity and a credit rating of AAA/AA.
IA SBBI US LT Corporate: IA SBBI US Long Term Corporate Bond Index: The index measures the performance of US dollar denominated bonds issued in the US investment grade bond market including US and non US corporate securities that have at least ten years to maturity and a credit rating of AAA/AA.
ICE Bank of America MOVE Index: The MOVE index, or Merrill Lynch Option Volatility Estimate Index, is a gauge of interest rate volatility in the U.S. Treasury market. It is calculated from options prices, which reflect the collective expectations of market participants about future volatility. The index measures the implied volatility of U.S. Treasury options across various maturities.
Bloomberg US Corporate Bond Index: The Bloomberg Barclays US Corporate Bond Index measures the investment grade, fixed-rate, taxable corporate bond market. It includes USD-denominated securities publicly issued by US and non-US industrial, utility and financial issuers.
Bloomberg US Financial Institutions Capped Index: The index measures the performance of U.S. dollar-denominated publicly-issued investment-grade corporate bonds in the financial sector. The index is market-capitalization weighted with a 5% cap on any one issuer and a pro rata distribution of any excess weight across the remaining issuers in the Underlying Index.
Bloomberg US High Yield Index: The Bloomberg US Corporate High Yield Index measures the performance of non-investment grade, US dollar-denominated, fixed-rate, taxable corporate bonds.
Ice BofA High Yield USD Emerging Markets Liquid Corporate Plus Index: the ICE BofA High Yield US Emerging Markets Liquid Corporate Plus Index is a subset of the ICE BofA Emerging Markets Liquid Corporate Plus Index, which includes only securities rated BB1 or lower.
Bloomberg: LF98YW Index: The Bloomberg US Corporate High Yield Bond Index measures the USD-denominated, high yield, fixed-rate corporate bond market. Securities are classified as high yield if the middle rating of Moody’s, Fitch and S&P is Ba1/BB+/BB+ or below. Bonds from issuers with an emerging markets country of risk, based on Bloomberg EM country definition, are excluded.
“YW” is the ticker to pull the yield-to-worst on the index.
Bloomberg: LF98TRUU Index: The Bloomberg US Corporate High Yield Bond Index measures the USD-denominated, high yield, fixed-rate corporate bond market. Securities are classified as high yield if the middle rating of Moody’s, Fitch and S&P is Ba1/BB+/BB+ or below. Bonds from issuers with an emerging markets country of risk, based on Bloomberg EM country definition, are excluded. This is the total return index level.
Morningstar SPBDLLY Index: Yield to maturity time series of the Morningstar LSTA US Leveraged Loan 100 Index. The Morningstar LSTA US Leveraged Loan Index is a market-value weighted index designed to measure the performance of the US leveraged loan market.
Bloomberg Investment Grade Index: The Bloomberg US Investment Grade Corporate Bond Index measures the performance of investment grade, corporate, fixed-rate bonds with maturities of one year or more.
Bloomberg Municipal Bond Index: measures the performance of investment grade, US dollar denominated, long term tax exempt bonds.
Bloomberg Municipal Bond High Yield Index: covers the U.S.-dollar denominated, non-investment grade, fixed-rate, municipal bond market and includes securities with ratings by Moody’s, Fitch and S&P of Ba1/BB+/BB+ or below.
Bloomberg Custom Municipal Short 1-5 Index: is the 1 to 5 year maturities of the US Municipal bond index.
Bloomberg Custom Municipal Short-Intermediate 1-10 Index: Index is the 1 to 10 year maturities of the US Municipal bond index.
Bloomberg US Treasury Index: includes all publicly issued, U.S. Treasury securities that are rated investment grade, and have $250 million or more of outstanding face value.
Investment Grade (IG) Municipal Bond Index: The Bloomberg US Municipal Bond Index measures the performance of investment grade, US dollar-denominated, long-term tax-exempt bonds.
High Yield (HY) Municipal Bond Index: The Bloomberg Municipal High Yield Bond Index measures the performance of non-investment grade, US dollar-denominated, and non-rated, tax-exempt bonds.
Definitions
Yield to Worst (YTW) is the lower of the yield to maturity or the yield to call. It is essentially the lowest potential rate of return for a bond, excluding delinquency or default.
P/E Ratio: The price-to-earnings ratio (P/E ratio) is the ratio for valuing a company that measures its current share price relative to its earnings per share (EPS).
City National Rochdale Proprietary Quality Ranking formula: 40% Dupont Quality (return on equity adjusted by debt levels), 15% Earnings Stability (volatility of earnings), 15% Revenue Stability (volatility of revenue), 15% Cash Earnings Quality (cash flow vs. net income of company) 15% Balance Sheet Quality (fundamental strength of balance sheet).
*Source: City National Rochdale proprietary ranking system utilizing MSCI and FactSet data. **Rank is a percentile
ranking approach whereby 100 is the highest possible score and 1 is the lowest. The City National Rochdale Core compares the weighted average holdings of the strategy to the companies in the S&P 500 on a sector basis. As of September 30, 2022. City National Rochdale proprietary ranking system utilizing MSCI and FactSet data.
Non-deposit investment Products are: • not FDIC insured • not Bank guaranteed • may lose value
Stay Informed.
Get our Insights delivered straight to your inbox.
More from the Quarterly Update
Put our insights to work for you.
If you have a client with more than $1 million in investable assets and want to find out about the benefits of our intelligently personalized portfolio management, speak with an investment consultant near you today.
If you’re a high-net-worth client who's interested in adding an experienced investment manager to your financial team, learn more about working with us here.
