Core Equity: Increasing Cyclical Exposure in Response to Improved Economic Outlook
Key Points
- Continue to focus on beneficiaries of key Digital Revolution theme.
- Proactive steps taken increase quality and upside return potential.
Since last fall, our confidence in the outlook for the U.S. economy has improved, as a resilient consumer and prospects for a normalization of monetary policy materially lower recession risk. Given this backdrop, the outlook for corporate profit growth has improved as well, and we have been methodically lowering our defensive tilt in core equity portfolios while increasing our exposure to stocks that would benefit from prospects of better and more sustained economic growth. We have also narrowed our focus on stocks in our digital revolution theme to those that are best positioned for spending on artificial intelligence.
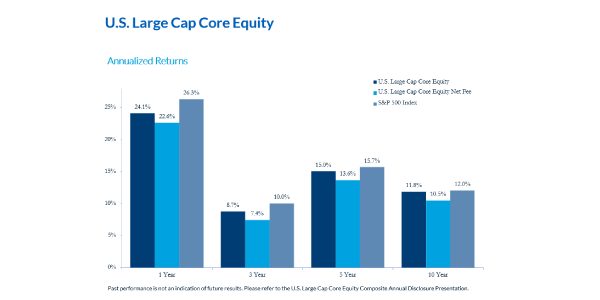
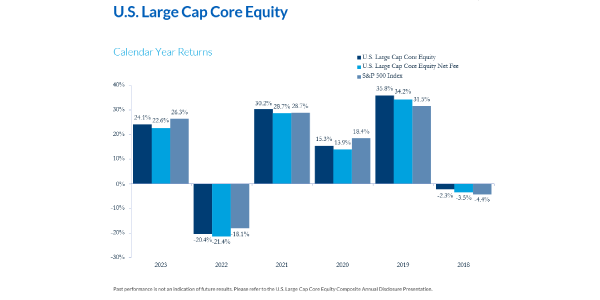
The nonstop upward momentum in the equity markets from the October lows continued over the first quarter, with the S&P 500 rising 10.5%. Our Core Equity Strategy increased 8%, net of fees, while our Aggressive Core Strategy increased 9.6%, net of fees. As we exited Q1, our largest industry group overweights were in Financial Services +3.5% and Semiconductors +2.1%, and our largest underweights were Tech Hardware -2.7% and Health Care Equipment and services -1.9%. Performance lagged in the Core strategy as a result of negative stock selection in semiconductors, healthcare and pharmaceutical stocks that more than offset outperformance in Capital Goods, Financial Services and Consumer Staples.
Chart 1: CNR Core Equity Strategy
Defensive vs. Cyclical Tilt
Source: FactSet, CNR Research, as of March 2024.
Information is subject to change and is not a guarantee of future results.
In addition to increasing cyclical exposure in strategies, we have taken proactive steps to lower our tracking error, raise our quality rank and increase the upside potential of the portfolio by either taking profits in stocks that did very well in 2023 or selling stocks with fundamental disappointments. We are optimistic these adjustments will enhance the return potential of the strategy on both an absolute and relative basis.
Chart 2: Quality Rank
Source: FactSet, CNR Research, as of March 2024.
Information is subject to change and is not a guarantee of future results. Indices are unmanaged, and one cannot invest directly in an index.
Important Information
The views expressed represent the opinions of City National Rochdale, LLC (CNR) which are subject to change and are not intended as a forecast or guarantee of future results. Stated information is provided for informational purposes only, and should not be perceived as personalized investment, financial, legal or tax advice or a recommendation for any security. It is derived from proprietary and non-proprietary sources which have not been independently verified for accuracy or completeness. While CNR believes the information to be accurate and reliable, we do not claim or have responsibility for its completeness, accuracy, or reliability. Statements of future expectations,estimates, projections, and other forward-looking statements are based on available information and management’s view as of the time of these statements. Accordingly, such statements are inherently speculative as they are based on assumptions which may involve known and unknown risks and uncertainties. Actual results, performance or events may differ materially from those expressed or implied in such statements.
Investing involves risk including loss of principal. The market price of a security may move up and down, sometimes rapidly and unpredictably. The securities of mid-cap companies may have greater price volatility and less liquidity than the securities of larger capitalized companies. Larger, more established companies may be unable to attain the high growth rates of successful, smaller companies during periods of economic expansion. Current and future holdings are subject to risk. There is no guarantee the fund will achieve its stated objective.
Index Definitions
S&P 500 Index: The S&P 500 Index, or Standard & Poor’s 500 Index, is a market-capitalization-weighted index of 500 leading publicly traded companies in the US It is not an exact list of the top 500 US companies by market cap because there are other criteria that the index includes.
Definitions
P/E Ratio: The price-to-earnings ratio (P/E ratio) is the ratio for valuing a company that measures its current share price relative to its earnings per share (EPS).
City National Rochdale Proprietary Quality Ranking formula: 40% Dupont Quality (return on equity adjusted by debt levels), 15% Earnings Stability (volatility of earnings), 15% Revenue Stability (volatility of revenue), 15% Cash Earnings Quality (cash flow vs. net income of company) 15% Balance Sheet Quality (fundamental strength of balance sheet).
*Source: City National Rochdale proprietary ranking system utilizing MSCI and FactSet data. **Rank is a percentile ranking approach whereby 100 is the highest possible score and 1 is the lowest. The City National Rochdale Core compares the weighted average holdings of the strategy to the companies in the S&P 500 on a sector basis. As of September 30, 2022. City National Rochdale proprietary ranking system utilizing MSCI and FactSet data.


© 2024 City National Bank. All rights reserved.
Non-deposit investment Products are: • not FDIC insured • not Bank guaranteed • may lose value
Stay Informed.
Get our Insights delivered straight to your inbox.
More from the Quarterly Update
Put our insights to work for you.
If you have a client with more than $1 million in investable assets and want to find out about the benefits of our intelligently personalized portfolio management, speak with an investment consultant near you today.
If you’re a high-net-worth client who's interested in adding an experienced investment manager to your financial team, learn more about working with us here.
