August 2024 Market Update
A Deep Dive into CNR’s Economic and Investment Outlook
August 29, 2024
August 29, 2024
Market Update Summary
In this month’s market update webinar, CNR CIO Charles Luke, and Senior Economist and Senior Portfolio Manager Paul Single discussed our latest thinking on the outlook for the economy and financial markets. They touched on changes to our Speedometers and economic forecasts, the geopolitical landscape, and election dynamics. To wrap up this month’s webinar, they provided perspectives on recent equity market volatility, interest rates and fixed income.
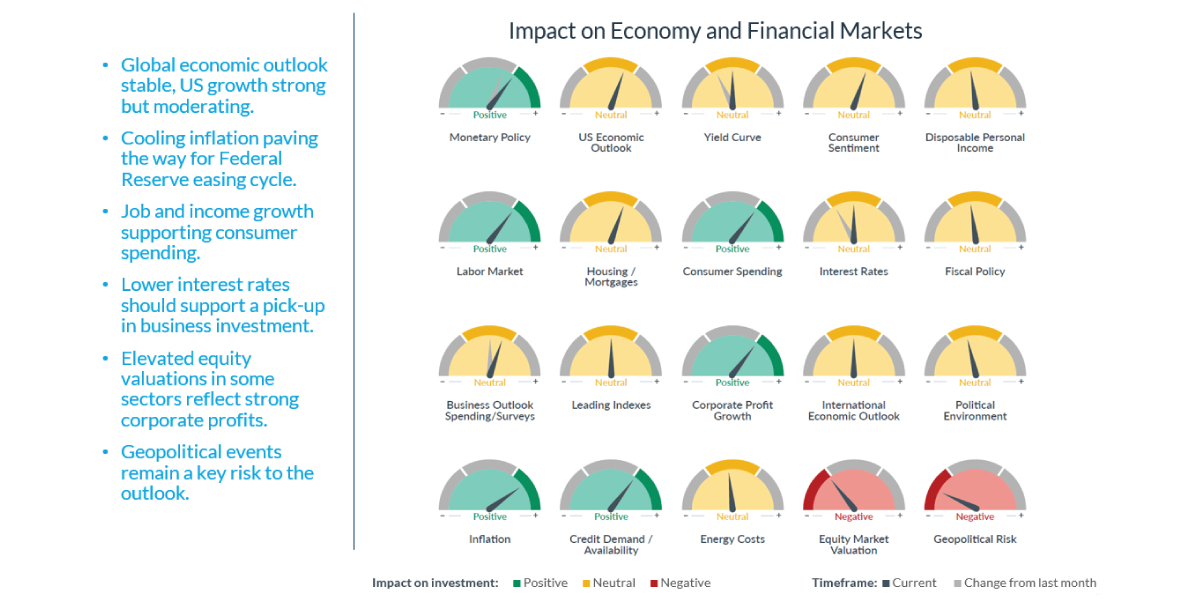
Source: Proprietary opinions based on CNR Research, as of August 2024. Information is subject to change and is not a guarantee of future results.
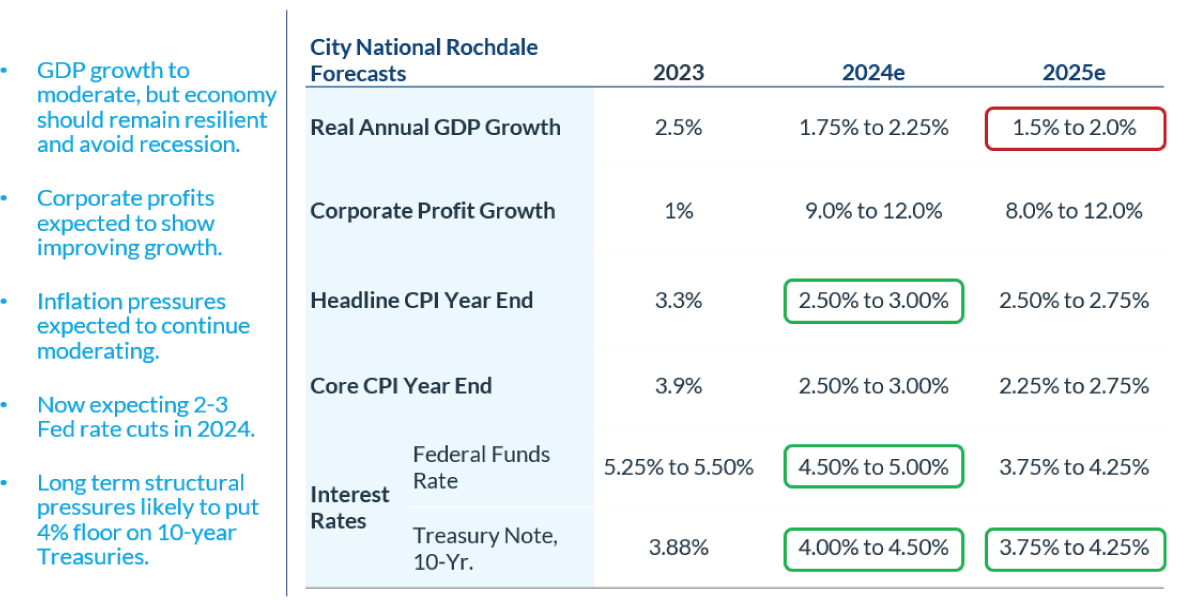
Gross domestic product (GDP) is the total monetary or market value of all the finished goods and services produced within a country’s borders in a specific time period. The Consumer Price Index (CPI) measures the monthly change in prices paid by U.S. consumers. e: estimate. Sources: Bloomberg, proprietary opinions based on CNR Research, as of August 2024. Information is subject to change and is not a guarantee of future results.
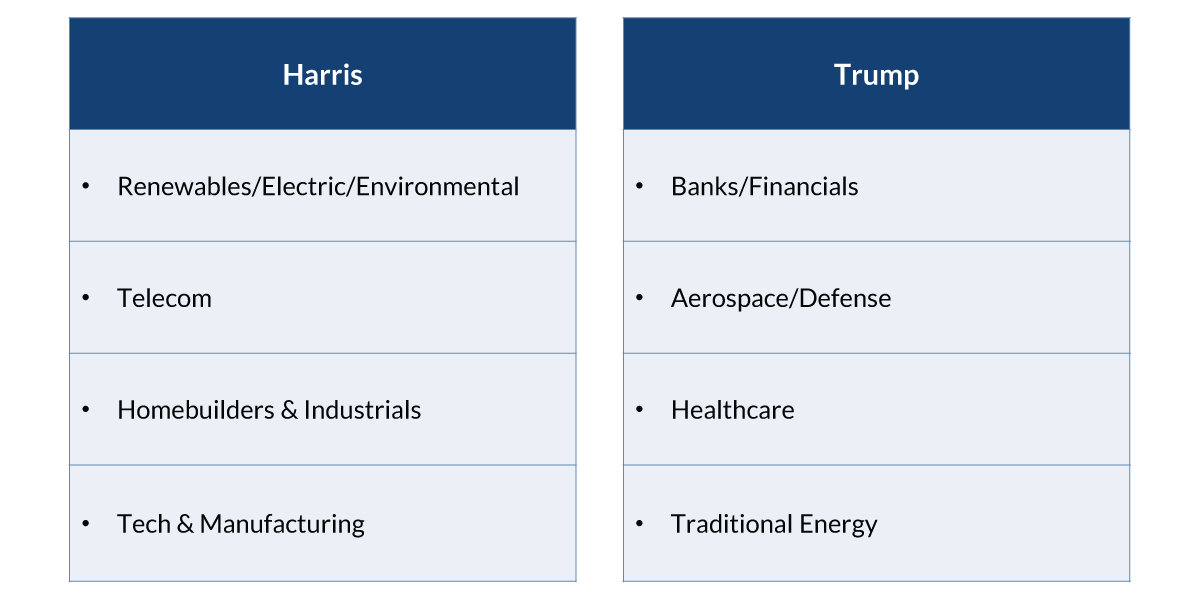
Source: CNR Research, as of August 2024.
Economic growth is slowing, and CNR has adjusted our metrics and forecasts for long-term GDP growth to 1.5% - 2.0%. However, we believe the recent market instability was due less to economic concerns and more to technical factors related to the Japanese yen carry trade that triggered systematic US equity sales. Geopolitical risks persist, with tensions elevated in the US, China relations, and ongoing geographical conflicts in the Middle East and eastern Europe. The tight, upcoming presidential and House races may increase market volatility. However, market performance doesn’t correlate with government control, and any sector benefits from the elected candidate are usually temporary.
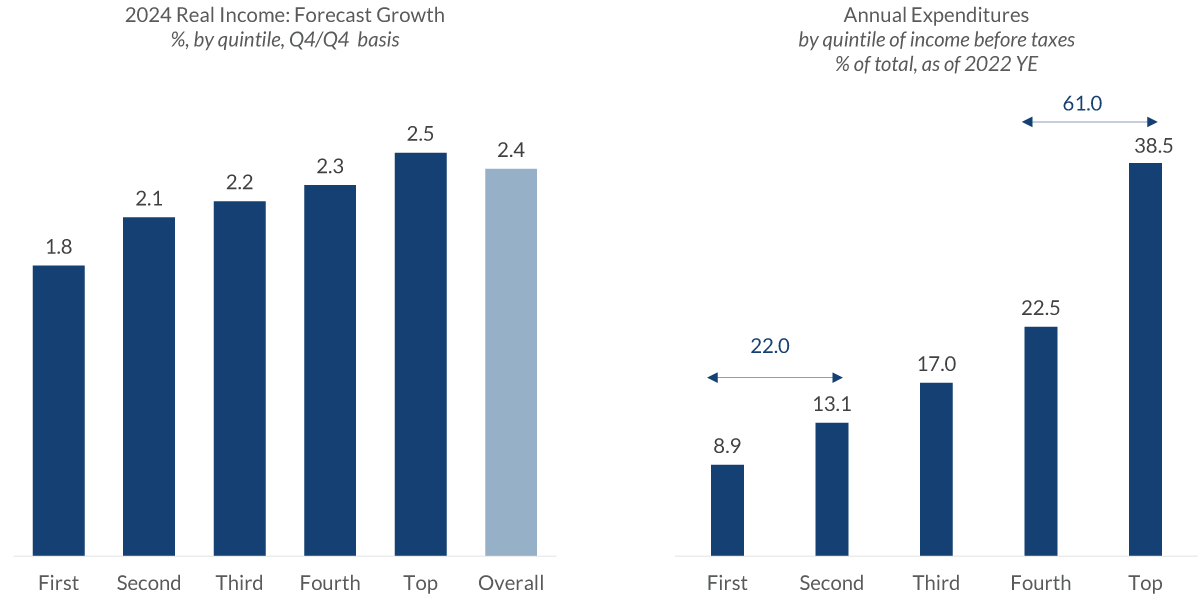
Data current as of August 27, 2024 Source: Goldman Sachs Global Investment Research, Bureau of Labor Statistics Information is subject to change and is not a guarantee of future results.
According to CNR, the US economy has entered a mature phase of the business cycle. Labor indicators suggest a normalizing of conditions rather than a weakening, with the recent uptick in unemployment driven more by increased supply rather than actual job cuts. Meanwhile, inflation should continue to moderate due to slowing wage growth, softer demand and easing shelter costs. Given this, the Fed's attention is becoming more balanced, with an effort to support the labor market and economy likely to play a more prominent role in upcoming policy decisions.
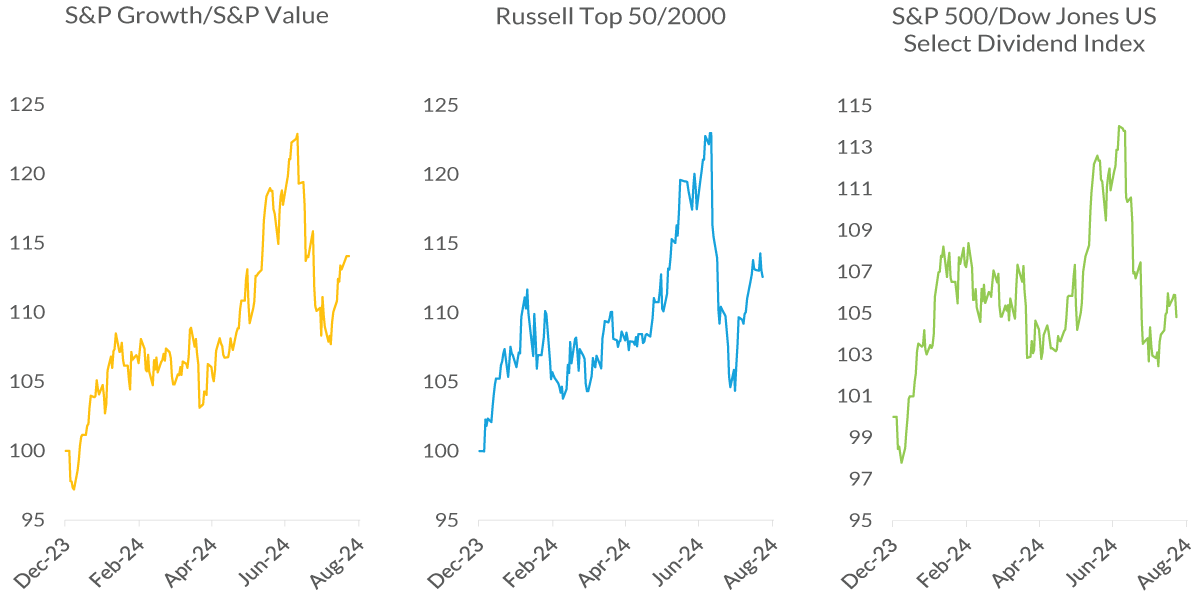
Source: Bloomberg, as of July 2024. Relative Returns rebased to 100. Information is subject to change and is not a guarantee of future results.
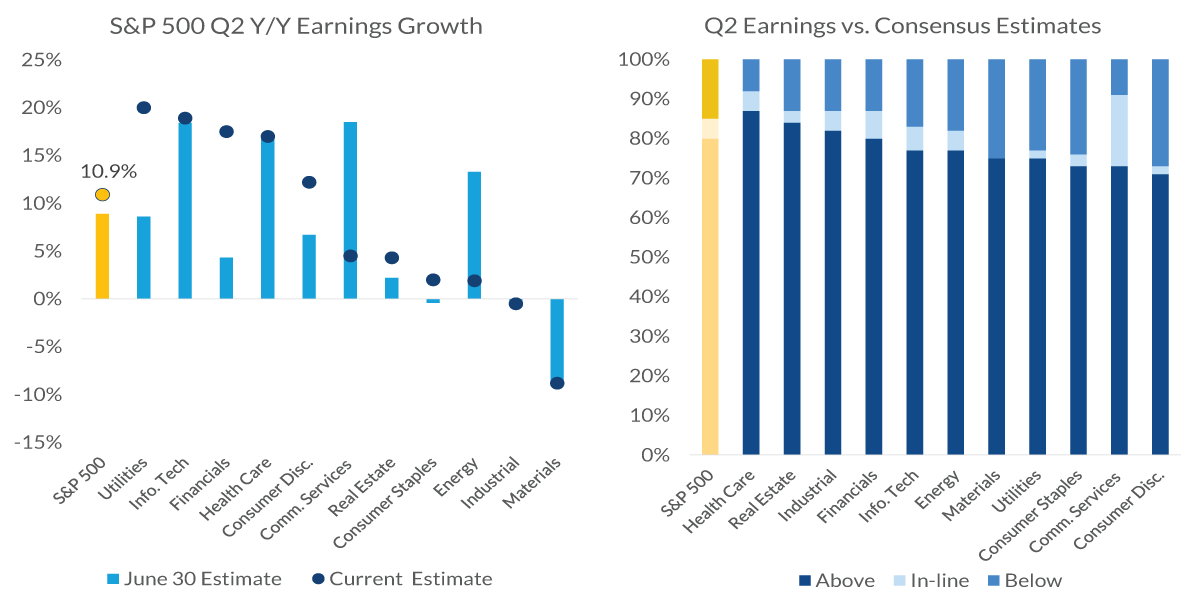
Source: FactSet, as of August 2024. Relative Returns rebased to 100. Information is subject to change and is not a guarantee of future results.
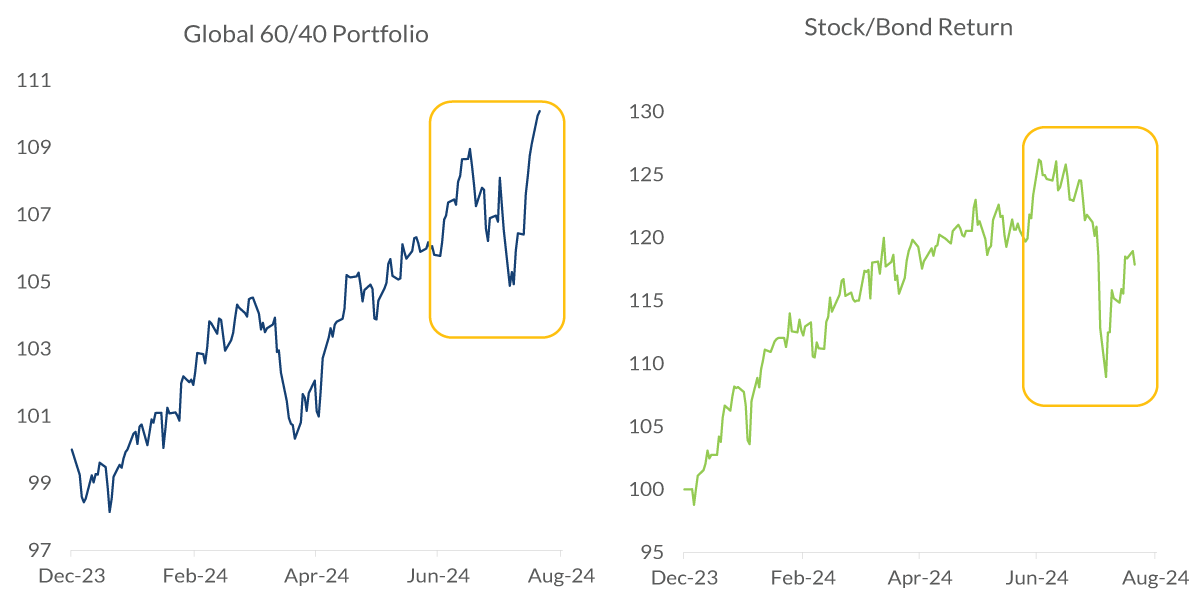
Source: Bloomberg, as of August 2024. Global 60/40 Portfolio: Bloomberg Global EQ:FI 60:40 Index. Relative Returns rebased to 100. Designed to measure cross-asset global market performance. The index rebalances monthly to 60% equities and 40% fixed income. Information is subject to change and is not a guarantee of future results.
In financial markets, positive inflation surprises and the softening job market, along with election volatility, prompted a shift from growth to value stocks in July, but this has largely reversed. Despite a drop in equities, crucial price levels have not been breached, highlighting the significance of market prices. S&P 500 earnings surpassed expectations by 2.3%, even though the size of earnings beats was below long-term averages. Given the complexity of market valuation, some sectors have high valuations while others have low valuations, providing a potential buffer during market downturns.
CNR’s equity strategy emphasizes quality, market competitiveness and financial robustness. We are overweight in semi-conductor, financial and healthcare sectors, and underweight in real estate and materials.
Recently, bonds have begun to resume their defensive role, providing a hedge against equity volatility. Despite the drop seen in yields, the fixed income market remains attractive. Despite structural pressures on interest rates, CNR believes now is a good time to purchase longer maturities. Historically, extending duration can enhance forward returns in bond portfolios as the Fed cuts rates.
Review Your Portfolio with Your Financial Advisor Today
City National Rochdale encourages you to review your investment portfolio with your advisor. Contact our financial professionals today to get help with your wealth planning needs.
Index Definitions
The Standard & Poor’s 500 Index (S&P 500) is a market capitalization-weighted index of 500 common stocks chosen for market size, liquidity and industry group representation to represent US equity performance.
The Bloomberg Barclays U.S. Corporate High Yield Index is an unmanaged, US-dollar-denominated, nonconvertible, non-investment-grade debt index. The index consists of domestic and corporate bonds rated Ba and below with a minimum outstanding amount of $150 million.
The Dow Jones U.S. Select Dividend Index aims to represent the US's leading stocks by dividend yield.
Bloomberg 60% Tax-Exempt High Yield/40% Municipal Investment Grade TR Index Unhedged 1% issuer cap: A custom index comprised 60% of the Bloomberg Municipal Bond High Yield Index TR Unhedged and 40% of the Bloomberg Municipal Bond Index TR Unhedged. The issuer cap is 1%.
The Russell 2000 Index is a stock market index that measures the performance of the 2,000 smaller companies included in the Russell 3000 Index.
The Russell Top 50 Index also known as the Russell Top 50 Mega Cap is a stock market index that measures the performance of the largest companies in the Russell 3000 Index.
The S&P 500 Growth Index is a stock index administered by Standard & Poor's-Dow Jones Indices. As its name suggests, the purpose of the index is to serve as a proxy for growth companies included in the S&P 500.
The S&P 500® Value measures constituents from the S&P 500 that are classified as value stocks based on three factors: the ratios of book value, earnings and sales to price.
Definitions
Municipal bonds (or “munis”) are a fixture among income-investing portfolios. Investors who want higher returns can invest in high yield municipal bonds.
Gross Domestic Product (GDP) is the total monetary or market value of all the finished goods and services produced within a country’s borders in a specific time period.
CNR Speedometers® are indicators that reflect forecasts of a 6- to 9-month time horizon. The colors of each indicator, as well as the direction of the arrows represent our positive/negative/neutral view for each indicator. Thus, arrows directed towards the (+) sign represents a positive view which in turn makes it green. Arrows directed towards the (-) sign represents a negative view which in turn makes it red. Arrows that land in the middle of the indicator, in line with the (0), represents a neutral view which in turn makes it yellow. All of these indicators combined affect City National Rochdale’s overall outlook of the economy.
Important Information
The views expressed represent the opinions of City National Rochdale, LLC (CNR), which are subject to change and are not intended as a forecast or guarantee of future results. Stated information is provided for informational purposes only, and should not be perceived as personalized investment, financial, legal or tax advice or a recommendation for any security. It is derived from proprietary and non-proprietary sources that have not been independently verified for accuracy or completeness. While CNR believes the information to be accurate and reliable, we do not claim or have responsibility for its completeness, accuracy or reliability. Statements of future expectations, estimates, projections and other forward-looking statements are based on available information and management's view as of the time of these statements. Accordingly, such statements are inherently speculative as they are based on assumptions that may involve known and unknown risks and uncertainties. Actual results, performance or events may differ materially from those expressed or implied in such statements.
All investing is subject to risk, including the possible loss of the money you invest. As with any investment strategy, there is no guarantee that investment objectives will be met, and investors may lose money. Diversification may not protect against market risk or loss. Past performance is no guarantee of future performance.
Indices are unmanaged, and one cannot invest directly in an index. Index returns do not reflect a deduction for fees or expenses.
CNR is free from any political affiliation and does not support any political party or group over another.
Equity investing strategies and products. There are inherent risks with equity investing. These risks include, but are not limited to, stock market, manager or investment style. Stock markets tend to move in cycles, with periods of rising prices and periods of falling prices.
Fixed Income investing strategies and products. There are inherent risks with fixed income investing. These risks include, but are not limited to, interest rate, call, credit, market, inflation, government policy, liquidity or junk bond risks. When interest rates rise, bond prices fall. This risk is heightened with investments in longer-duration fixed income securities and during periods when prevailing interest rates are low or negative.
© 2024 City National Rochdale, LLC. All rights reserved.
CITY NATIONAL ROCHDALE LLC NON-DEPOSIT INVESTMENT PRODUCTS: • ARE NOT FDIC INSURED • ARE NOT BANK GUARANTEED • MAY LOSE VALUE