April 2024 Market Update
A Deep Dive into CNR’s Economic and Investment Outlook
April 25, 2024
April 25, 2024
Strong Fundamentals Despite GDP Dip Early in 2024
Although the 1.6% rise in first-quarter U.S. gross domestic product (GDP) came as a surprise to economists and the market, economic fundamentals continue to be in place to overcome short-term market volatility, according to our leadership team at City National Rochdale. Our outlook for a soft landing remains strong, with a 70% probability of sustained, albeit slowing, growth in 2024.
We expect more modest returns across asset classes this year and are keeping our focus on high-quality U.S. stocks and bonds. We remain conservative overall on equity and have gradually raised equity exposure as risks to the economic outlook diminish. We don’t anticipate the 10-year Treasury to go below 4% this year, which suggests that investors may want to lock in income with less risk. Investment grade corporate and municipal bonds may offer attractive yields with less risk than high-yield bonds.
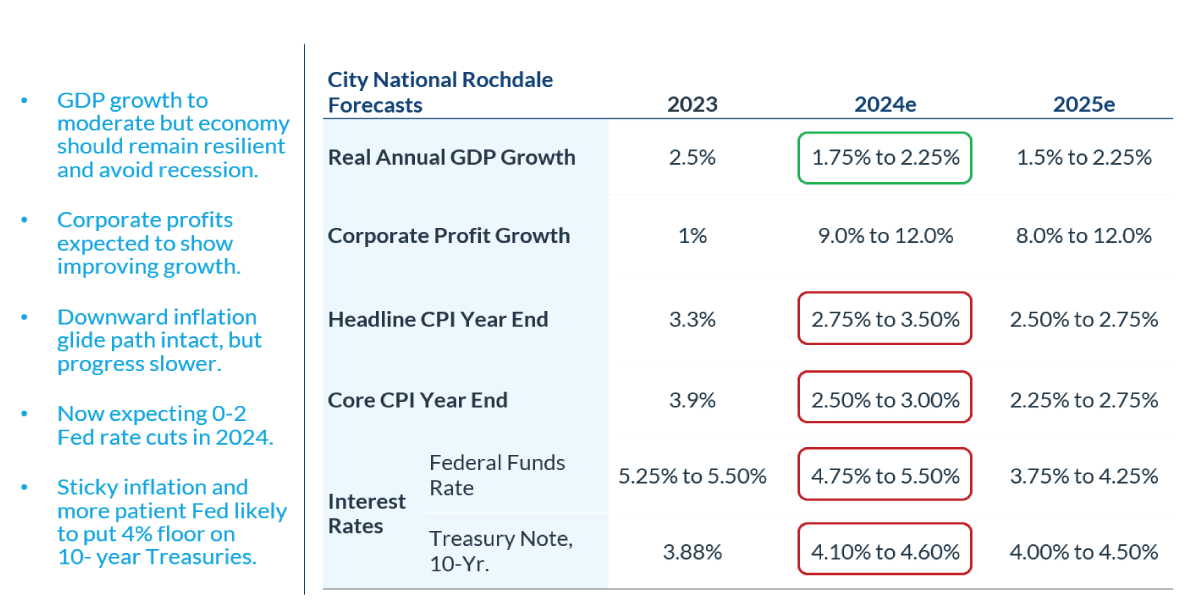
GDP growth is expected to moderate in 2024 and 2025. We expect GDP to grow between 1.75% and 2.25% this year and between 1.5% and 2.25% in 2025.
Gross domestic product (GDP) is the total monetary or market value of all the finished goods and services produced within a country’s borders in a specific time period. The Consumer Price Index (CPI) measures the monthly change in prices paid by U.S. consumers.
e: estimate.
Sources: Bloomberg, proprietary opinions based on CNR Research, as of March 2024. Information is subject to change and is not a guarantee of future results.
Corporate profits are likely to improve in 2024 from 1% growth in 2023 to 9%-12% in 2024 and 8%-12% in 2025.
Despite the stickiness of inflation, we don’t anticipate further rate hikes this year. However, we do expect the Federal Reserve to remain patient on policy easing, with zero to two rate cuts a possibility sometime in the second half of 2024.
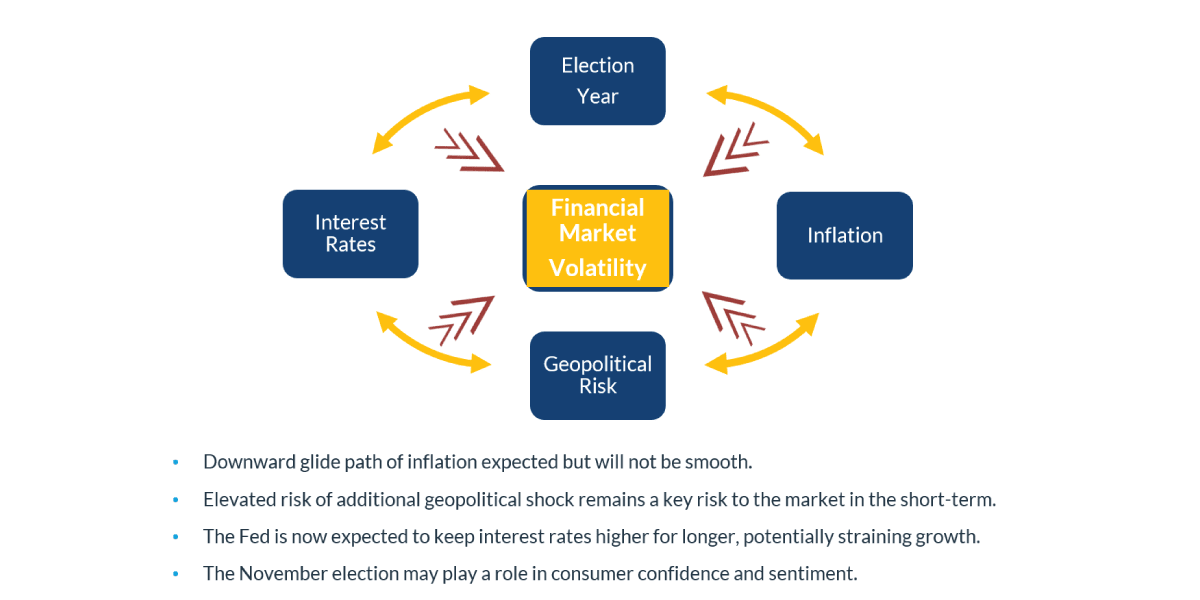
CNR’s “Higher for Longer” thesis remains intact. With the Fed anticipated to keep interest rates higher for longer, we think inflation will continue its downward path but with some bumps along the way. The biggest short-term risk is from a possible geopolitical shock. Consumer confidence and market sentiment could also be impacted by the November presidential election results.
Source: CNR Research, as of April 2024.
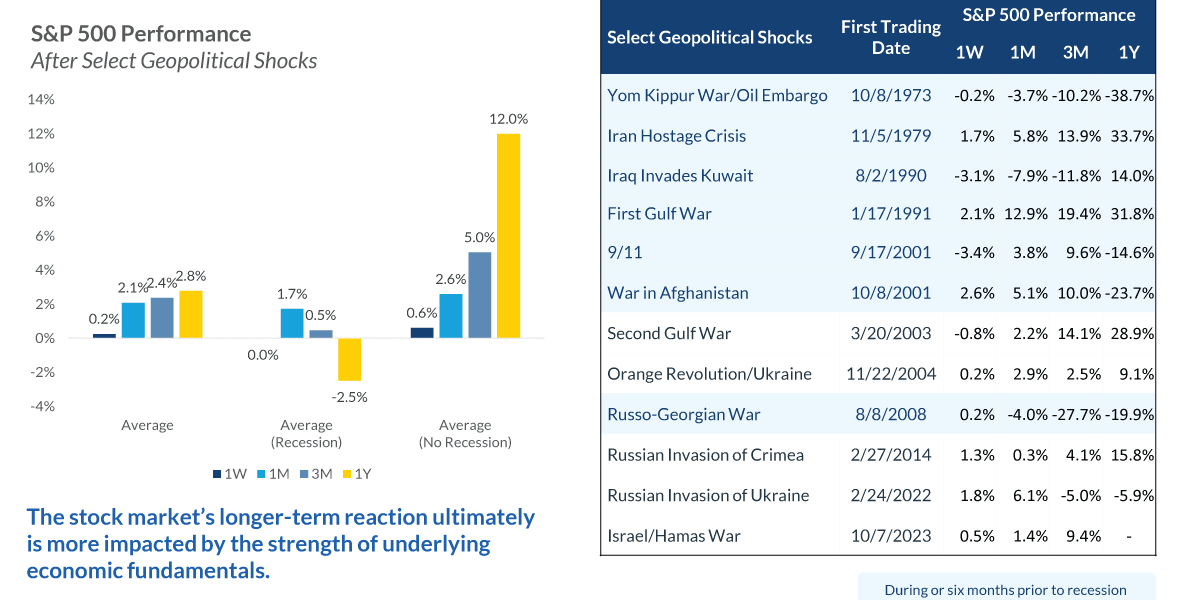
Geopolitical risks such as wars in the Middle East and between Ukraine and Russia, along with tension between Taiwan and China, are taking on more importance than they have had in a generation, and we remain watchful of unfolding events. However, over the long term, markets tend to be driven by underlying fundamentals, and we believe the strength and stability of the U.S. economy will keep markets resilient despite some short-term volatility.
Source: FactSet, as of February 2024.
Indices are unmanaged, and one cannot invest directly in an index. Index returns do not reflect a deduction for fees or expenses.
Past performance is no guarantee of future results.
Similarly, in spite of concern about the impact of domestic politics on markets, presidential election years typically provide solid returns. Only in five presidential election years since 1928 has S&P 500 performance been negative. Indeed, equities have historically performed well regardless of which political party is in control of government, as factors like corporate profits, interest rates and the direction of Fed policy tend to be more important. While there may be some unpredictability in an election year, market declines can present opportunities for investors.

Source: Factset, as of January 2024.
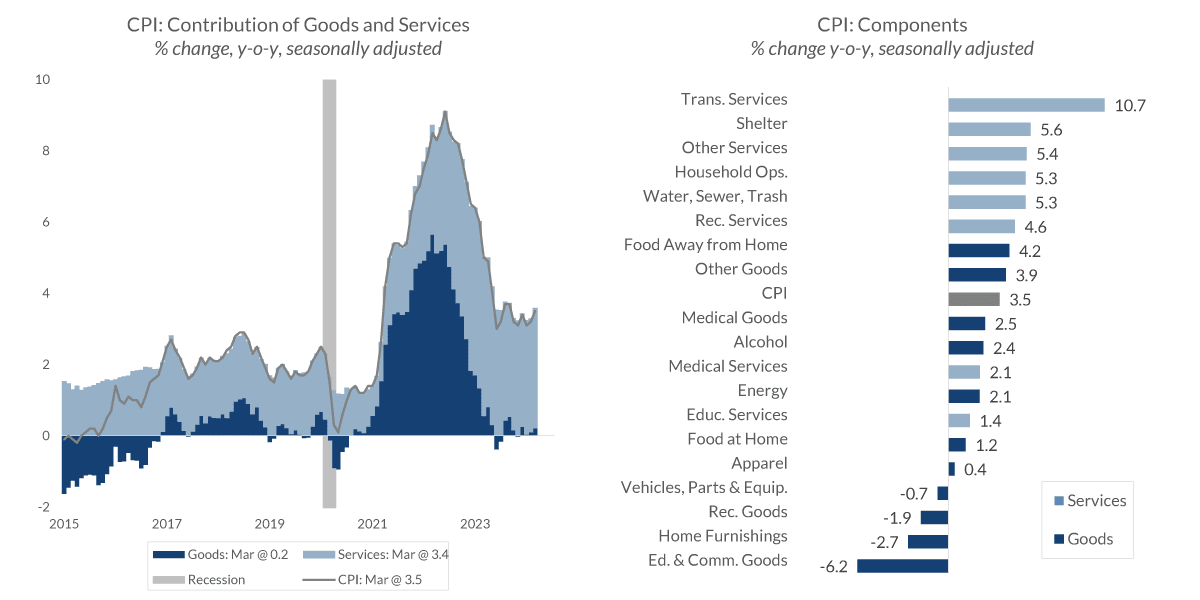
Consumers tend to focus heavily on household expenses, which contributes to the perception that the economy is not healthy. Inflation today is driven primarily by the purchase of services and by housing, which is the largest component of the consumer price index (36%).
Data current as of March 24, 2024
Source: Bureau of Labor Statistics
Information is subject to change and is not a guarantee of future results.
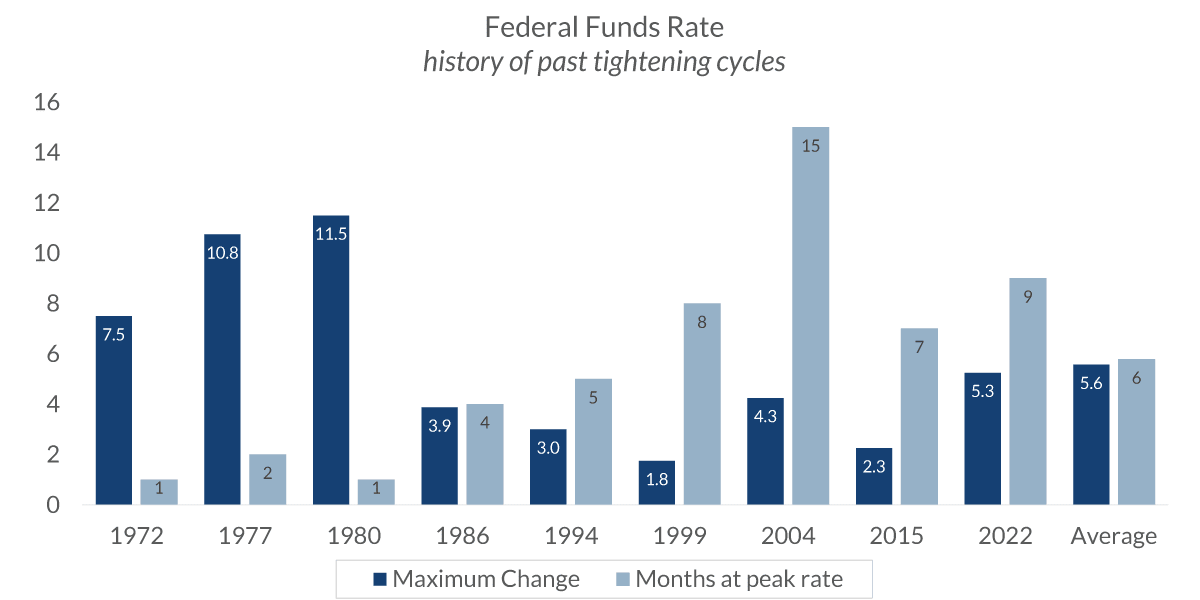
The Fed historically has kept the federal funds rate higher for an average of seven months. Currently, peak rates have been in place for nine months. The Fed is holding a hawkish stance and will likely need two or three months of tame inflation before it will cut rates. The Fed is taking its time, in part, because consumer spending has been generally immune to higher interest rates.
Data current as of March 24, 2024
Source: Federal Reserve Bank
Information is subject to change and is not a guarantee of future results.
Despite the decline from 2023 highs, interest rates have recently rebounded above 4.5% as markets reprice Fed rate cut expectations in response to sticky inflation readings.

Sources: Bloomberg, CNR Research, as of April 2024. Information is subject to change and is not a guarantee of future results.
Fixed income yields have been volatile, and that’s likely to continue, but bonds continue to offer the best risk-adjusted returns in years. Higher yields offset the instability and reduce it over time.
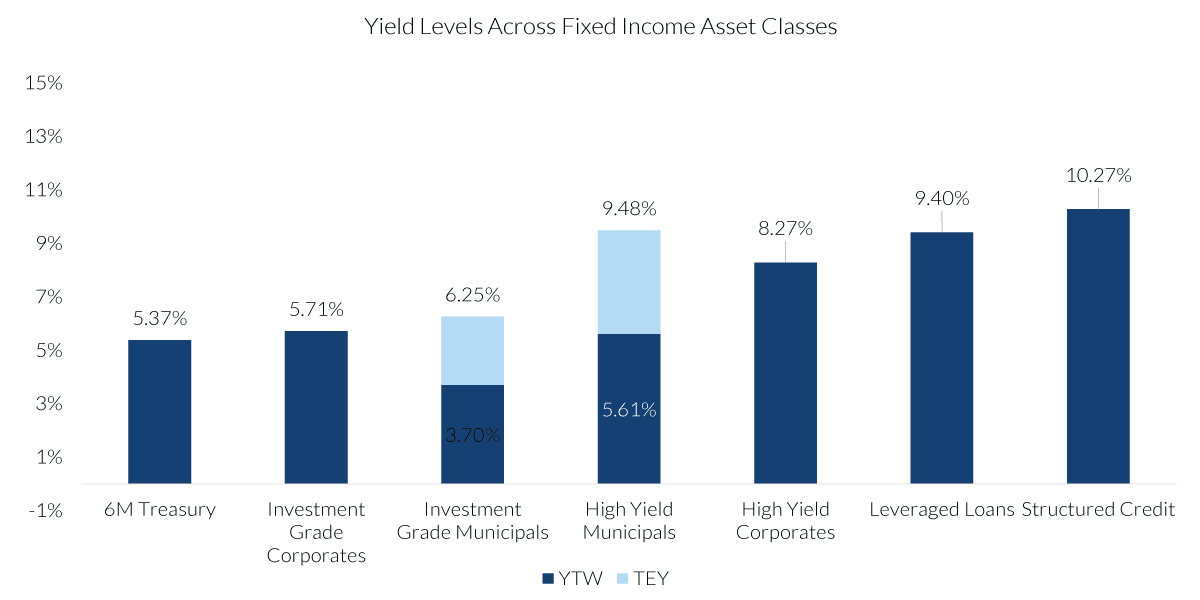
* Assumes the highest marginal federal tax rate of 37%, plus the 3.8% Medicare surcharge. As of 4/19/2024.
Source: Bloomberg, CNR Research. Information is subject to change and is not a guarantee of future results.
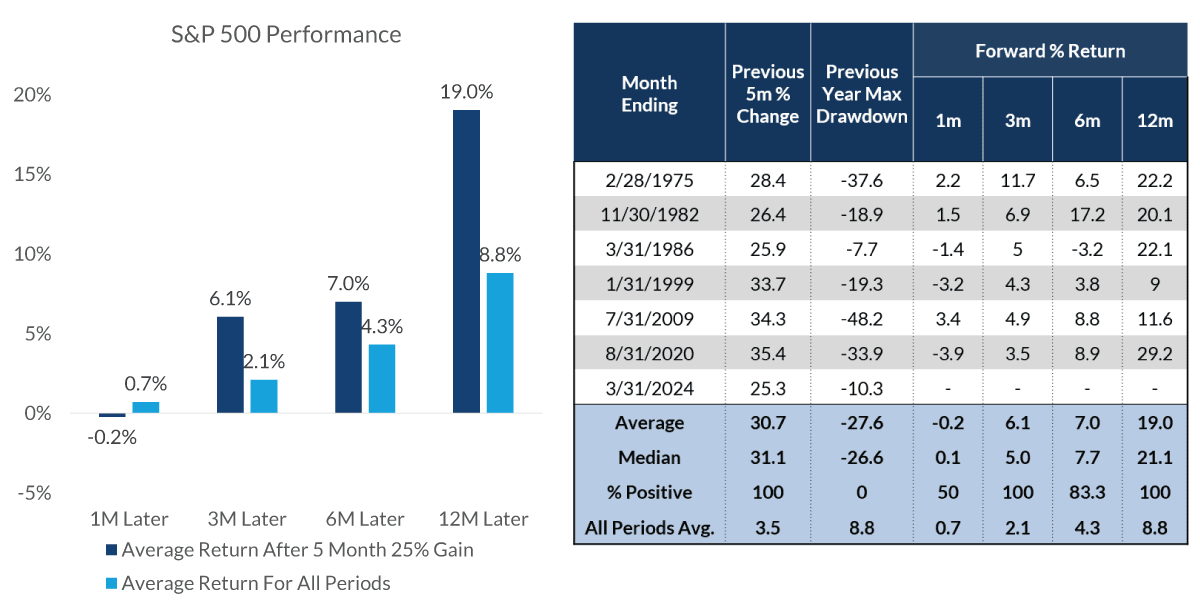
The S&P 500 has seen a 25% gain over the past five months, something that has happened only seven times since 1945. While this has raised concerns that the market may be ripe for a correction, after those seven previous episodes, the S&P 500 went on to return an average 19% one year later. This doesn’t mean a normal correction in the coming months won’t occur, but given the underlying strength of economic and corporate fundamentals, we would regard any such pullback in stock prices as a buying opportunity.
Source: Ned Davis Research, as of February 2024.
Indices are unmanaged, and one cannot invest directly in an index. Index returns do not reflect a deduction for fees or expenses.
Past performance is no guarantee of future results.
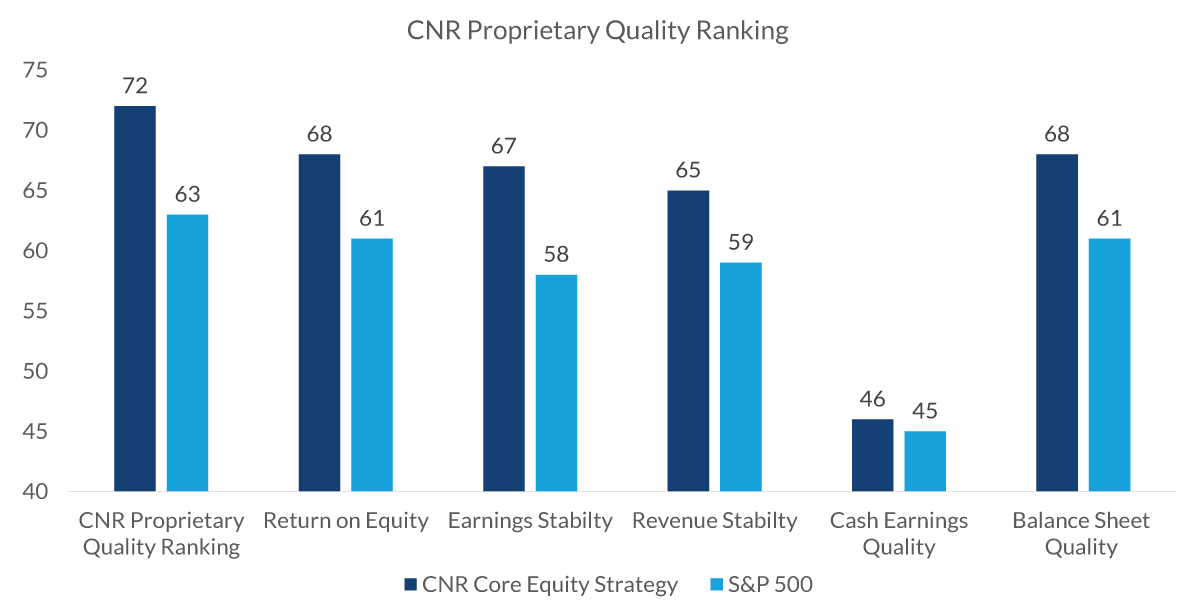
In our equity strategy, we have been gradually ratcheting down our defensive positioning, but we continue to focus on holding quality companies, with an emphasis on components such as earnings, revenue stability and return on equity. We think this leaves us well positioned for a more volatile, higher-for-longer environment, and we are poised to take advantage of opportunities or dislocations the market offers in the coming months to add quality investments as well as to think about diversifying portfolios for a potential broadening of market leadership.
Source: FactSet, CNR Research, as of April 2024.
City National Rochdale Proprietary Quality Ranking is the weighted average sum of securities held in the strategy versus the S&P 500 at the sector level using the below footnoted formula. City National Rochdale Proprietary Quality Ranking formula: 40% Dupont Quality (return on equity adjusted by debt levels), 15% Earnings Stability (volatility of earnings),15% Revenue Stability (volatility of revenue), 15% Cash Earnings Quality (cash flow vs. net income of company) 15% Balance Sheet Quality (fundamental strength of balance sheet).
While short-term volatility can be disconcerting to investors, it’s normal. The overall fundamentals of the U.S. economy are strong, and earnings are solid. We’re invested in quality companies that we expect to grow over time.
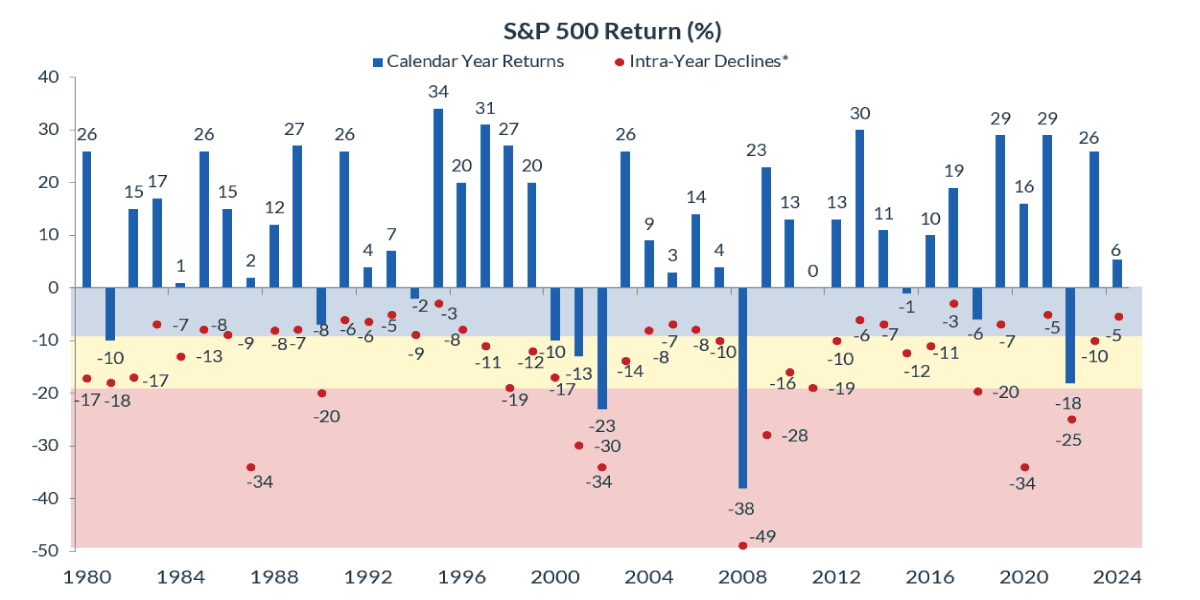
Sources: Bloomberg, CNR Research, as of April 23, 2024.
*Intra-year declines are the largest declines within the calendar year.
Indices are unmanaged, and one cannot invest directly in an index. Index returns do not reflect a deduction for fees or expenses.
Past performance is no guarantee of future results.
Review Your Portfolio with Your Financial Advisor Today
City National Rochdale encourages you to review your investment portfolio with your advisor. Contact our financial professionals today to get help with your wealth planning needs.
Index Definitions
The Standard & Poor’s 500 Index (S&P 500) is a market capitalization-weighted index of 500 common stocks chosen for market size, liquidity and industry group representation to represent U.S. equity performance.
The Bloomberg Barclays U.S. Corporate High Yield Index is an unmanaged, U.S.-dollar-denominated, nonconvertible, non-investment-grade debt index. The index consists of domestic and corporate bonds rated Ba and below with a minimum outstanding amount of $150 million.
Bloomberg US 1-15 Yr. Municipal Bond Index consists of a broad selection of investment grade general obligation and revenue bonds of maturities ranging from one year to 17 years.
Bloomberg Tax-Exempt HY is market value-weighted and designed to measure the performance of U.S. dollar-denominated high-yield municipal bonds issued by U.S. states, the District of Columbia, U.S. territories and local governments or agencies.
Morningstar LSTA US Leveraged Loan Index is designed to measure the performance of the 100 largest facilities in the US leveraged loan market.
Palmer Square CLO BB Index is a rules-based observable pricing and total return index for CLO debt sold in the United States, rated A, BBB or BB (or equivalent rating), i.e. mezzanine CLO debt.
High Yield (HY) Municipal Bond Index: The Bloomberg Municipal High Yield Bond Index measures the performance of non-investment grade, US dollar-denominated, and non- rated, tax-exempt bonds.
MSCI EAFE Index. The MSCI EAFE (Europe, Australasia, Far East) Index is a free float-adjusted market capitalization weighted index that is designed to measure developed equity market results, excluding the US and Canada.
The MSCI EM Asia Index is a stock market index that tracks the performance of large and mid cap companies in eight emerging Asian countries. The index is a subset of the MSCI Emerging Markets Index, which covers 25 countries with fast-growing economies
Bloomberg US 6M Treasury Bill Index: The 6 Month Treasury Bill Rate is the yield received for investing in a US government issued treasury bill that has a maturity of 6 months.
The Bloomberg Barclays US Intermediate Corporate Bond Index is a measure of the investment grade, fixed-rate, taxable corporate bond market. It includes USD-denominated securities publicly issued by US and non-US industrial, utility and financial issuers that have between 1 and up to, but not including, 10 years to maturity. The maturity range of the bonds included in the index is between 1 to 9.9999 years.
Bloomberg Tax-Exempt HY is market value-weighted and designed to measure the performance of U.S. dollar-denominated high-yield municipal bonds issued by U.S. states, the District of Columbia, U.S. territories and local governments or agencies.
The Bloomberg US Municipal Bond Index measures the performance of investment grade, US dollar-denominated, long-term tax-exempt bonds.
The Bloomberg Barclays US Corporate High Yield Bond Index is a measure of the USD-denominated, high yield, fixed-rate corporate bond market.
The Bloomberg US Aggregate Bond Index measures the performance of investment grade, US dollar-denominated, fixed-rate taxable bonds.
Bloomberg US 1-15 Yr. Municipal Bond Index consists of a broad selection of investment grade general obligation and revenue bonds of maturities ranging from one year to 17 years.
The Dow Jones U.S. Select Dividend Index aims to represent the U.S.'s leading stocks by dividend yield.
Indexes are unmanaged and do not reflect a deduction for fees or expenses. Investors cannot invest directly in an index.
Definitions
6M T-Bills: The 6 Month Treasury Bill Rate is the yield received for investing in a US government issued treasury bill that has a maturity of 6 months.
Employment Index: U.S. jobs with the exception of farmwork; unincorporated self-employment; and employment by private households, the military, and intelligence agencies.
A consumer price index (CPI) measures changesin the price level of a market basket of consumer goods and services purchased by households. The CPI is a statistical estimate constructed using the prices of a sample of representative items whose prices are collected periodically.
A collateralized loan obligation (CLO) is a single security backed by a pool of debt.
A leveraged loan is a type of loan that is extended to companies or individuals that already have considerable amounts of debt or poor credit history.
A high-yield bond, or junk bond, is a corporate bond that represents debt issued by a firm with the promise to pay interest and return the principal at maturity. Junk bonds are issued by companies with poorer credit quality.
Muni Bond: A municipal bond is a debt security issued by a state, municipality or county to finance its capital expenditures, including the construction of highways, bridges or schools. These bonds can be thought of as loans that investors make to local governments.
Liquidity Management: The liquidity index calculates the days required to convert a company's trade receivables and inventory into cash.
Investment Grade Municipal Bonds: Investment-grade municipal bonds are debt securities, issued by state and local governments carrying the lowest credit risk that a bond issuer may default. Investment Grade Municipal Bonds: Bloomberg Municipal Bond Inter-Short 1-10 Year Total Return Index.
Investment Grade Corporate Bonds: Investment grade corporate bonds are low-risk bonds. Because they are bonds, they are not tied to equity. Instead, they are like debt notes issued by a corporation. Investment Grade Corporate Bonds: Bloomberg Intermediate Corporate Bond Index.
The “core” Personal Consumption Expenditures (PCE) price index is defined as prices excluding food and energy prices. The core PCE price index measures the prices paid by consumers for goods and services without the volatility caused by movements in food and energy prices to reveal underlying inflation.
Municipal bonds (or “munis”) are a fixture among income-investing portfolios. Investors who want higher returns can invest in high yield municipal bonds.
Gross Domestic Product (GDP) is the total monetary or market value of all the finished goods and services produced within a country’s borders in a specific time period.
Yield to Worst (YTW) is the lower of the yield to maturity or the yield to call. It is essentially the lowest potential rate of return for a bond, excluding delinquency or default.
CNR Speedometers® are indicators that reflect forecasts of a 6 to 9 month time horizon. The colors of each indicator, as well as the direction of the arrows represent our positive/negative/neutral view for each indicator. Thus, arrows directed towards the (+) sign represents a positive view which in turn makes it green. Arrows directed towards the (-) sign represents a negative view which in turn makes it red. Arrows that land in the middle of the indicator, in line with the (0), represents a neutral view which in turn makes it yellow. All of these indicators combined affect City National Rochdale’s overall outlook of the economy.
The 4P analysis is a proprietary framework for global equity allocation. Country rankings are derived from a subjective metrics system that combines the economic data for such countries with other factors including fiscal policies, demographics, innovative growth and corporate growth. These rankings are subjective and may be derived from data that contain inherent limitations. MSCI Emerging Markets Asia Index is a free float-adjusted market capitalization index that is designed to measure equity market performance in the Asian emerging markets.
Quality ranking: City National Rochdale Proprietary Quality Ranking is the weighted average sum of securities held in the strategy versus the S&P 500 at the sector level using the below footnoted formula. City National Rochdale Proprietary Quality Ranking formula: 40% Dupont Quality (return on equity adjusted by debt levels), 15% Earnings Stability (volatility of earnings),15% Revenue Stability (volatility of revenue), 15% Cash Earnings Quality (cash flow vs. net income of company) 15% Balance Sheet Quality (fundamental strength of balance sheet).
Important Information
The views expressed represent the opinions of City National Rochdale, LLC (CNR) which are subject to change and are not intended as a forecast or guarantee of future results. Stated information is provided for informational purposes only, and should not be perceived as personalized investment, financial, legal or tax advice or a recommendation for any security. It is derived from proprietary and non-proprietary sources which have not been independently verified for accuracy or completeness. While CNR believes the information to be accurate and reliable, we do not claim or have responsibility for its completeness, accuracy, or reliability. Statements of future expectations, estimates, projections, and other forward-looking statements are based on available information and management's view as of the time of these statements. Accordingly, such statements are inherently speculative as they are based-on assumptions which may involve known and unknown risks and uncertainties. Actual results, performance or events may differ materially from those expressed or implied in such statements.
All investing is subject to risk, including the possible loss of the money you invest. As with any investment strategy, there is no guarantee that investment objectives will be met, and investors may lose money. Diversification may not protect against market risk or loss. Past performance is no guarantee of future performance.
Indices are unmanaged, and one cannot invest directly in an index. Index returns do not reflect a deduction for fees or expenses.
CNR is free from any political affiliation and does not support any political party or group over another.
Bonds are subject to interest rate risks and will decline in value as interest rates rise.
HY: Investing in securities that are not investment grade offers a higher yield but also carries a greater degree of risk of default or downgrade and are more volatile than investment grade securities, due to the speculative nature of their investments.
Equity investing strategies & products. There are inherent risks with equity investing. These risks include, but are not limited to stock market, manager or investment style. Stock markets tend to move in cycles, with periods of rising prices and periods of falling prices.
Fixed Income investing strategies & products. There are inherent risks with fixed income investing. These risks include, but are not limited to, interest rate, call, credit, market, inflation, government policy, liquidity or junk bond risks. When interest rates rise, bond prices fall. This risk is heightened with investments in longer-duration fixed income securities and during periods when prevailing interest rates are low or negative.
High yield securities. Investments in below-investment-grade debt securities, which are usually called “high yield” or “junk bonds,” are typically in weaker financial health. Such securities can be harder to value and sell, and their prices can be more volatile than more highly rated securities. While these securities generally have higher rates of interest, they also involve greater risk of default than do securities of a higher-quality rating.
Municipal securities. The yields and market values of municipal securities may be more affected by changes in tax rates and policies than similar income-bearing taxable securities. Certain investors' incomes may be subject to the Federal Alternative Minimum Tax (AMT), and taxable gains are also possible. Investments in the municipal securities of a particular state or territory may be subject to the risk that changes in the economic conditions of that state or territory will negatively impact performance. These events may include severe financial difficulties and continued budget deficits, economic or political policy changes, tax base erosion, state constitutional limits on tax increases and changes in the credit ratings.
CITY NATIONAL ROCHDALE LLC NON-DEPOSIT INVESTMENT PRODUCTS: • ARE NOT FDIC INSURED • ARE NOT BANK GUARANTEED • MAY LOSE VALUE